More features
UNDER CONSTRUCTION THIS FEATURES ARE AVAILABLE ONLY IN THE JAVASCRIPT. NOT SUPPORTED IN R YET
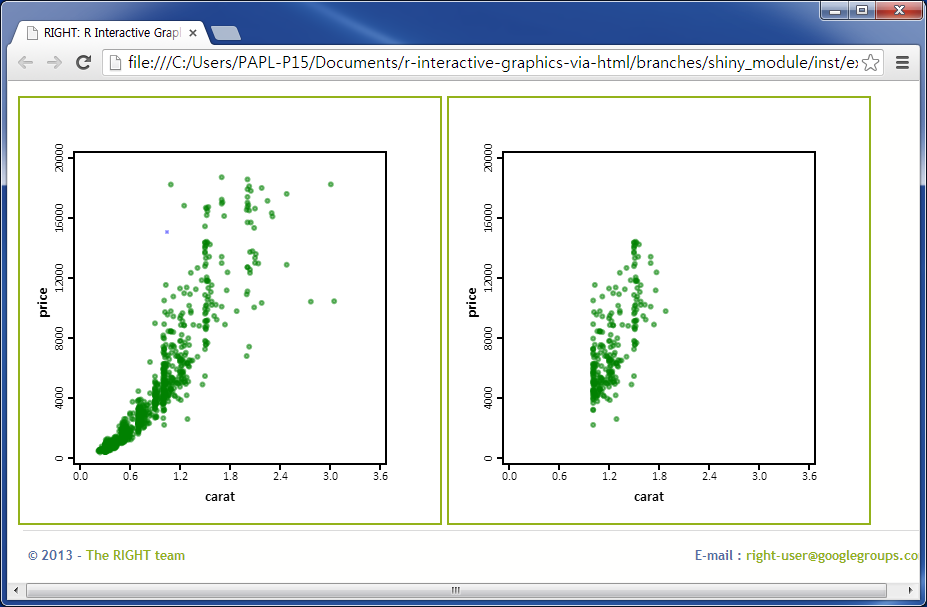
- Sub Setting Using sub setting, RIGHT users can draw the specific part which satisfies the boolean condition. To use this feature type :
> subSet: 'price < 15000 && carat > 1 && carat < 2'
UNDER CONSTRUCTION UNDER CONSTRUCTION UNDER CONSTRUCTION
You can see a difference from the original one. The right graph is using sub setting "price < 15000 && carat > 1 && carat < 2"
- Color RIGHT users can set colors. Default color is green. To use this feature type :
> RIGHT(plot(price ~ carat, diamonds, type="p", col="red"))
You can see the graph with different color. The right graph is using "red" color.

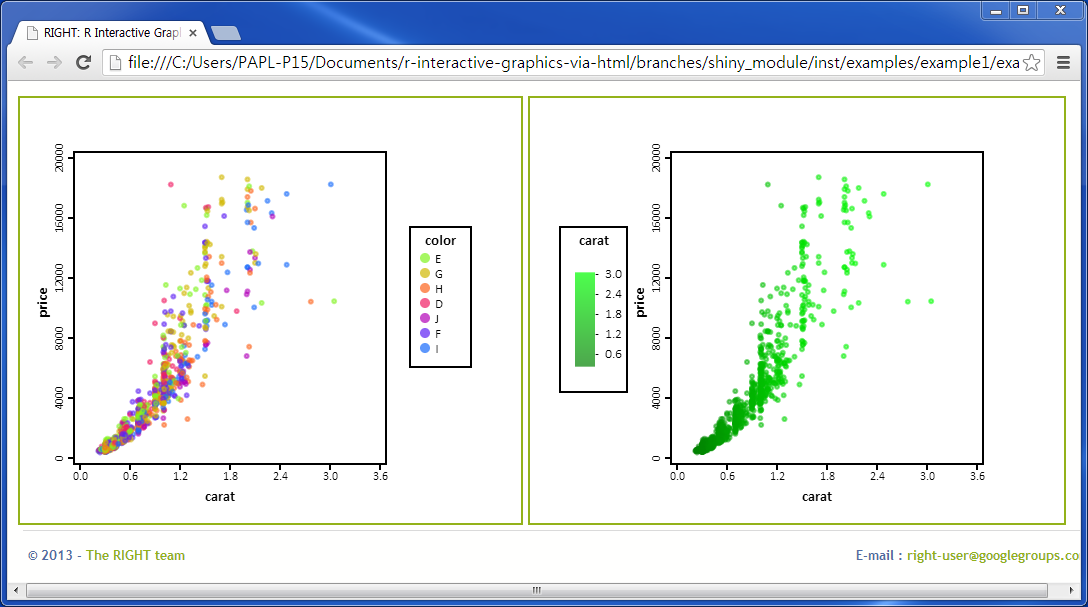
- Legend A legend contains a list of the variables appearing in the chart and an example of their appearance. This information allows the data from each variable to be identified in the chart. (reference)
> RIGHT(plot(price ~ carat, diamonds, type="p", legend: 'color', position: 'right')
        plot(price ~ carat, diamonds, type="p", legend: 'carat', position: 'left'),
        diamonds, dir = "TEST")
UNDER CONSTRUCTION UNDER CONSTRUCTION UNDER CONSTRUCTION
Only supported in javascript part.
You can see the graph with colorful legend. Legend can be positioned on left or right side.