Getting Started
After installing RIGHT package successfully, you can draw your own interactive graphs very easily.
Since RIGHT syntax is based on R-basic graphic, even beginners can use RIGHT package with ease. You just need to wrap R-basic syntax with RIGHT bracket.
For example, in original R, you can draw basic scatter grpahs like below.
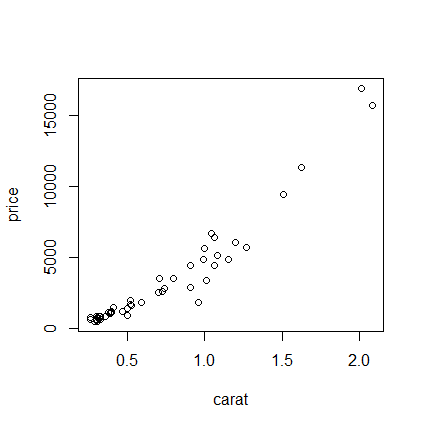
> subDiamonds <- diamonds[sample(1:nrow(diamonds), 50, T) ,]
> plot(price ~ carat, subDiamonds, type="p")
And it will show like below graph.
Now, what you need to get our RIGHT graph is just wrapping with RIGHT bracket.
> RIGHT(plot(price ~ carat, subDiamonds, type="p"))
Finally you can get the exactly same graph, but beautiful and interactive one, on your default browser!