Advanced RIGHT
In this page, you can learn advanced RIGHT features with few example codes.
1. Drawing multiple graphs
You can draw multiple graphs in one page very easily. If you want to draw three grahps, just type like below :
> RIGHT({plot(price ~ color, subArray, type = "p")
        hist(color, subArray)
        pie(color, subArray)})
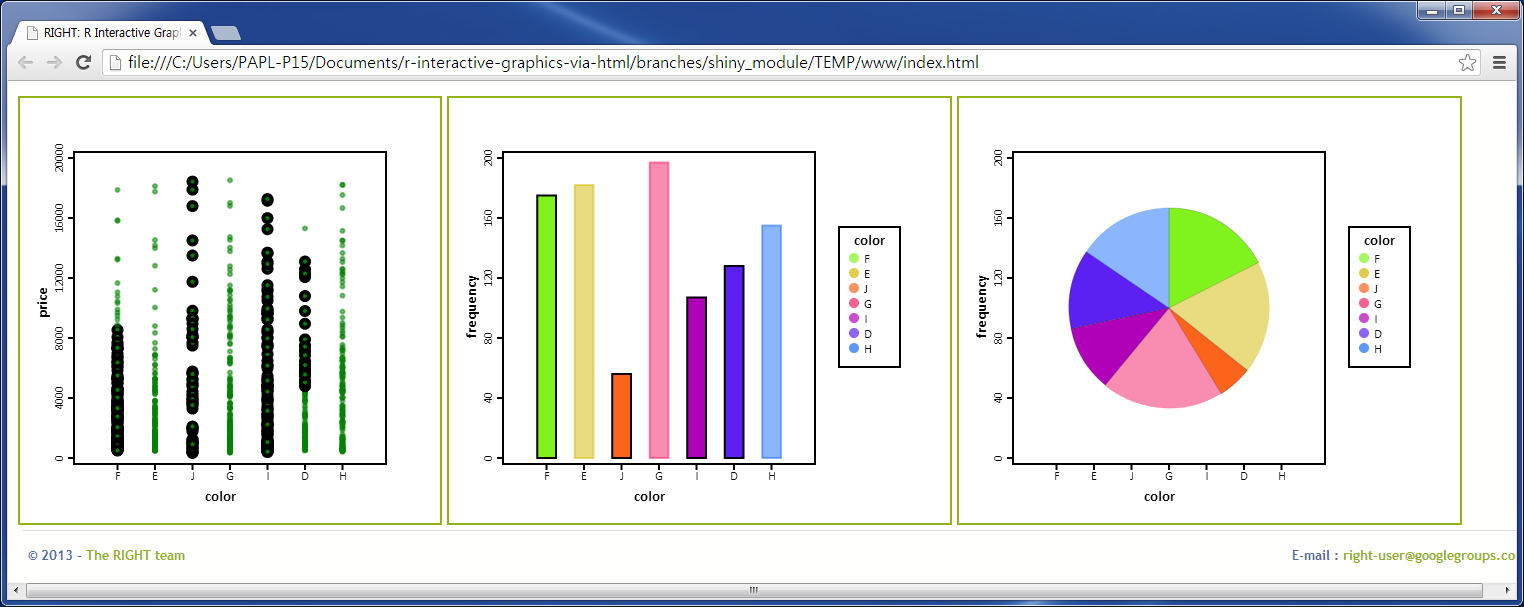
It will show three interactive graphs like below. From left, plot draw a scatter graph, hist draws a bar graph, and finally pie draws a pie graph.
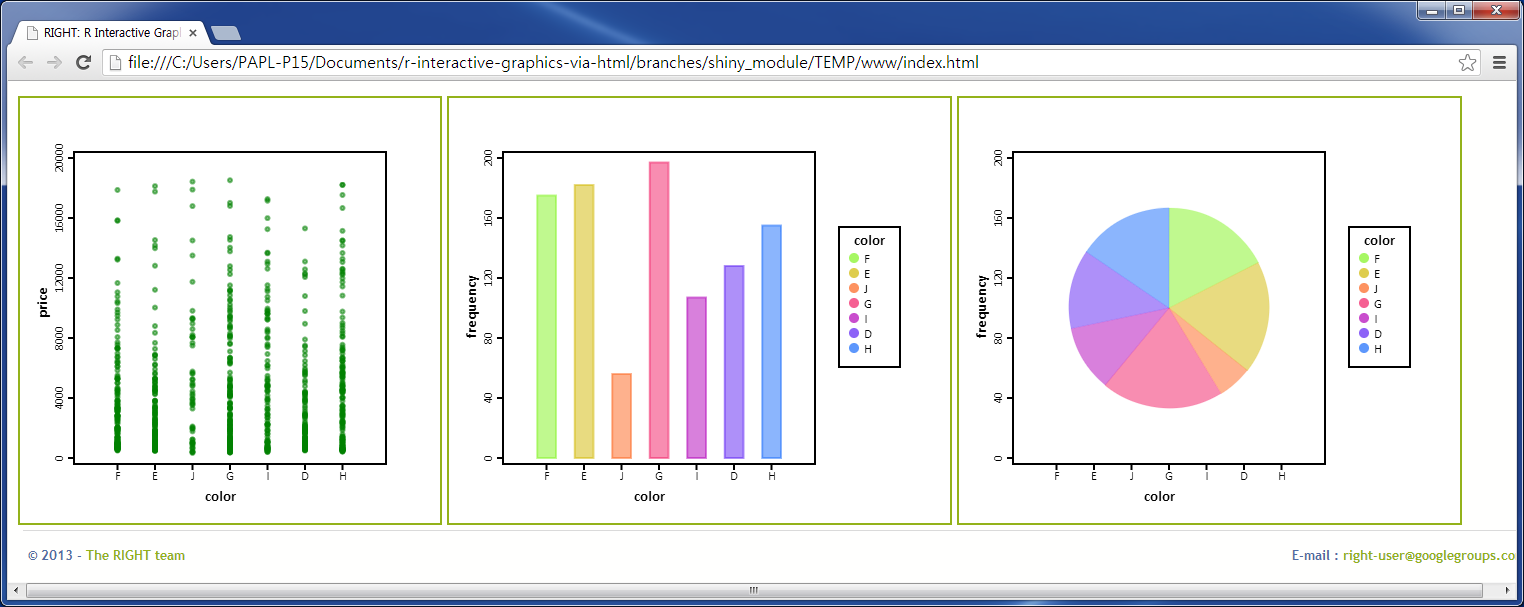 All graphs, of course, are interactively connected
2. Overlaying graphs
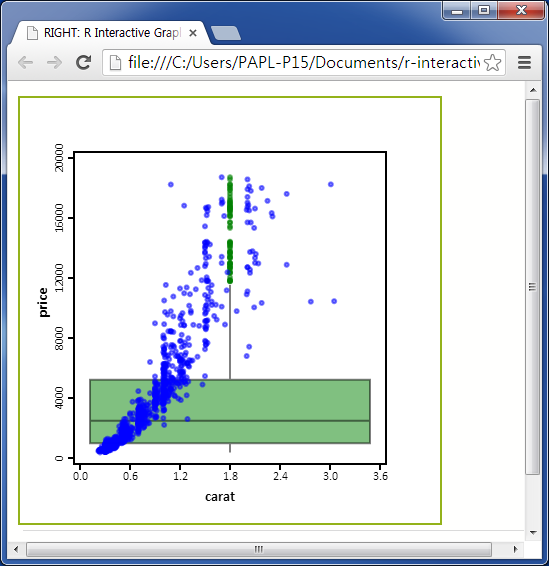
Multiple objects can be drawn in one container. To draw box-and-whisker and scatter plot type :
   RIGHT({boxplot(price ~ carat, subArray)
          plot(price ~ carat, subArray, col = 'blue', type = "p")})
UNDER CONSTRUCTION UNDER CONSTRUCTION UNDER CONSTRUCTION
It will draw overlaid graphs in one axis.
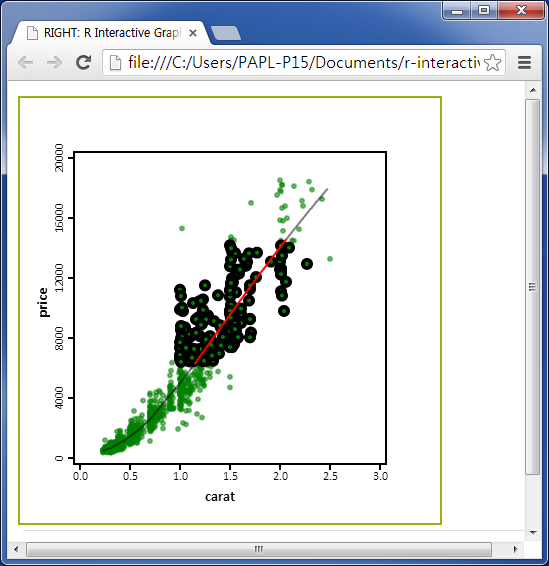
 Here is a more complex example where a loess line is overlaid on a scatter plot:
library(ggplot2)
rm(list = ls())

set.seed(123456)

subArray <- diamonds[sample(1:nrow(diamonds), 1000, TRUE), ]

fitObj <- loess(price ~ carat, subArray)
xRange <- range(subArray$carat)
fitArray <- data.frame(carat = seq(xRange[1], xRange[2], length.out = 100))
fitArray$price <- predict(fitObj, newdata = fitArray)

RIGHT({plot(price ~ carat, subArray, type = "p")
       lines(price ~ carat, fitArray)})